Table of Contents
The Role of Business Intelligence
Major Challenges in Business Intelligence Management
- Data Silos and Disconnected Systems
- Lack of Real-Time Insights and Slow Decision Making
- Scalability and Performance Bottlenecks
- Difficulty in User Adoption and Accessibility
- Compliance and Security Risks in Data Analytics
- Lack of Data Quality and Governance
- High Implementation Costs and ROI Concerns
- Ensuring Actionable Insights from BI
Key Benefits of Adopting BI Solutions
- Data-Driven Decision-Making
- Real-Time Insights for Agility
- Predictive Analytics for Future Planning
- Improved Data Accessibility and Collaboration
- Smoother Scalability and Operational Expansion
- Enhanced Compliance and Risk Management
- How Power BI Empowers Organizations with Real-Time Analytics
- Why Businesses Choose Power BI Over Other BI Tools
- Power BI as a Foundation for Business Intelligence in Lumify360
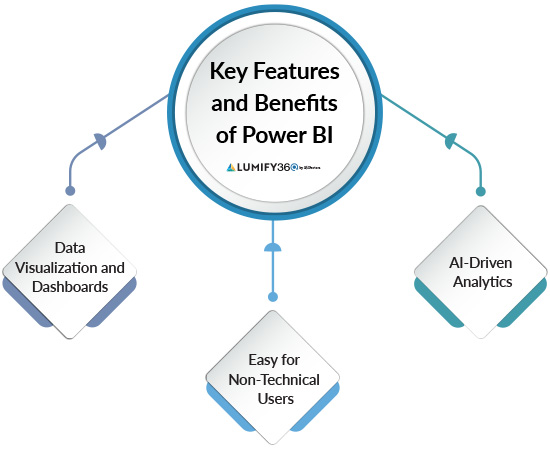
Key Features and Benefits of Power BI
- Data Visualization and Interactive Dashboards
- AI-Driven Analytics and Data Modeling
- Self-Service BI for Non-Technical Users
Power BI Dashboards: Transforming Business Insights
- How Power BI Dashboards Enhance Reporting and Decision-Making
- Customization and Real-Time Data Monitoring
- Use Cases: How Businesses Can Leverage Power BI Dashboards
- Power BI Dashboards + Lumify360: A Smarter Approach to Business Intelligence
Lumify360 Integration of Power BI for Smarter Analytics
- Unified Data Analytics Across Systems
- AI-Powered Predictive Analytics
- Risk-Adjusted Performance Metrics
- Automated Data Enrichment for More Accurate Insights
- Faster, More Actionable Decision-Making
Industry-Specific Applications of Power BI in Lumify360
Introdution
In the digital age, businesses are generating vast amounts of data at an unprecedented rate. However, without the ability to analyze and interpret this data, organizations risk being overwhelmed by information without extracting meaningful insights. Business Intelligence (BI) is the ideal solution, enabling businesses to transform raw data into strategic decision-making insights.
BI tools help organizations identify trends, measure performance, forecast outcomes, and optimize operations. With increasing competition across industries, BI can be the solution for future-oriented companies to stay ahead. Organizations utilizing BI solutions will gain a competitive edge, improving operational efficiency, enhancing customer experiences, and making proactive, data-driven decisions.
Traditionally, business decisions were based on historical reports and intuition. However, as data sources multiplied and market conditions evolved, organizations needed real-time insights to make informed decisions. Experts believe that BI has come a long way from 2000 when the internet, mobile phones, and laptops were still in their infancy to 2025 when organizations collect so much data that they are overwhelmed by it. One estimate is that 35% of organizations actively utilize BI dazzling dashboards that make it easier to understand. TechTarget
This shift toward data-driven decision-making allows businesses to:
- Reduce risks by identifying potential threats and opportunities early.
- Optimize strategies by understanding customer behavior and market trends.
- Improve efficiency by automating reporting and analysis.
- Enhance profitability by making data-backed financial and operational decisions.
Businesses have various BI tools available. Microsoft Power BI is considered a market leader in this domain. Designed to provide interactive dashboards, real-time analytics, and AI-driven insights, Power BI enables organizations to extract value from data quickly and efficiently. Whether it’s a small business or a large enterprise, Power BI helps users visualize complex datasets, generate reports effortlessly, and make data-backed strategic decisions.
While Power BI is a powerful standalone tool, its full potential is unlocked when integrated with a comprehensive business intelligence platform. Lumify360 has integrated Power BI as its native data visualization and reporting engine, offering businesses a unified solution for real-time analytics, KPI tracking, and predictive performance insights.
The Role of Business Intelligence
BI is critical in transforming raw data into actionable insights, allowing businesses to improve performance, efficiency, and competitiveness.
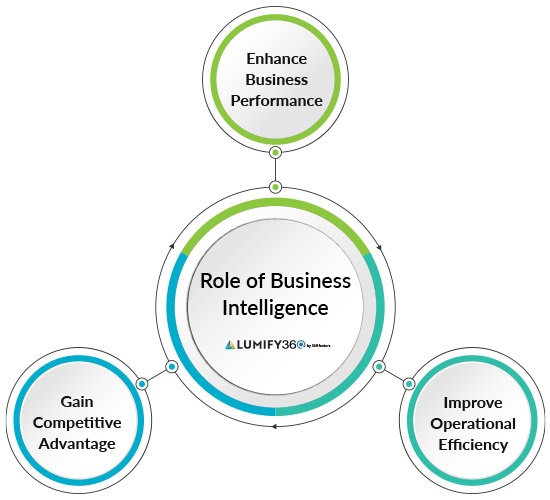
- Enhance Business Performance: Consolidate data from multiple sources to track KPIs, measure success, and identify improvement areas, enabling informed decisions that drive profitability and strategic growth.
- Improve Operational Efficiency: Automate reporting, streamline workflows, and minimize manual data processing to optimize resources, reduce costs, and allow employees to focus on high-value tasks.
- Gain Competitive Advantage: Leverage real-time insights to anticipate market trends, respond swiftly to changes, and stay ahead of competitors with proactive decision-making.
Major Challenges in Business Intelligence Management
Many organizations struggle with data accessibility, integration, and usability. Traditional BI solutions often require manual data extraction, complex reporting, and reliance on IT teams, limiting the agility of business users.
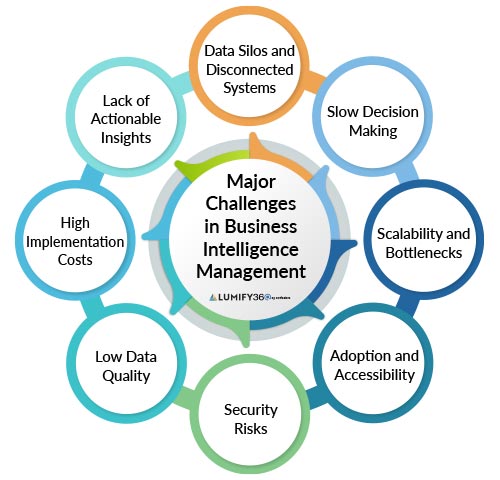
Power BI addresses these challenges by offering a scalable, user-friendly, and AI-powered analytics platform that simplifies data-driven decision-making.
Data Silos and Disconnected Systems
Many organizations store data across disconnected systems CRM software, ERP solutions, spreadsheets, cloud applications, and on-premises databases. This fragmentation makes it difficult to get a single source of truth, leading to inconsistent reporting and poor decision-making.
Lack of Real-Time Insights and Slow Decision-Making
Traditional BI reporting often relies on static reports that are updated weekly or monthly, limiting a business’s ability to react to market changes in real-time. Delays in reporting lead to missed opportunities, inefficiencies, and increased risk exposure.
Scalability and Performance Bottlenecks
Many BI tools struggle to handle large datasets and require extensive IT support for maintenance. As mid-sized businesses grow, their data needs become more complex, and traditional BI solutions that are not designed to scale become impractical.
Difficulty in User Adoption and Accessibility
Many BI platforms require technical expertise, limiting access to non-technical finance, sales, HR, and operations users. A lack of proper training or intuitive tools often leads to low adoption rates and reliance on data specialists for reporting.
Compliance and Security Risks in Data Analytics
Businesses in regulated industries (banking, insurance, healthcare) must ensure that BI reports comply with industry regulations like GDPR, HIPAA, and SOX. Without proper governance controls, data leaks, unauthorized access, and compliance violations are risks.
Lack of Data Quality and Governance
BI success depends on high-quality, clean, and reliable data. Inconsistent data formats, duplicate records, and incomplete datasets lead to inaccurate reports and misleading insights. Without proper governance, organizations risk compliance violations and data security threats.
High Implementation Costs and ROI Concerns
BI implementation requires investment in software, infrastructure, and skilled personnel. Some businesses struggle to justify the upfront costs without seeing immediate returns on investment.
Ensuring Actionable Insights from BI
Simply generating reports is not enough-businesses need insights that drive meaningful action. Many organizations struggle to turn BI dashboards into practical strategies due to information overload.
Key Benefits of Adopting BI Solutions
Adopting a BI solution offers several advantages for organizations looking to stay ahead in an increasingly complex and competitive landscape:
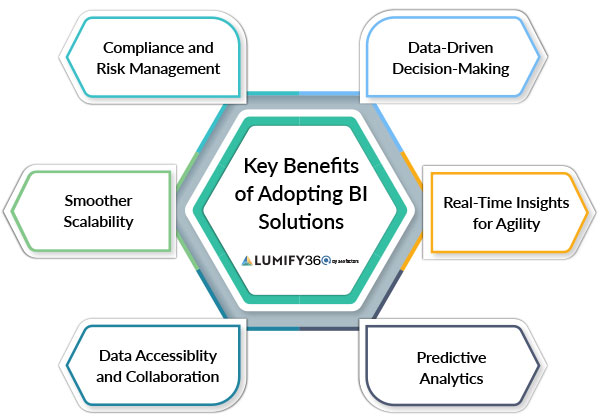
Data-Driven Decision-Making
BI tools empower businesses to make strategic, data-backed decisions instead of relying on intuition or guesswork. With interactive dashboards and AI-driven insights, decision-makers can evaluate real-time trends and historical performance to drive better outcomes.
Real-Time Insights for Agility
In today’s fast-paced business environment, reacting quickly to changes is crucial. BI solutions provide real-time analytics, enabling organizations to:
- Monitor business health instantly using live dashboards.
- Detect issues early and address them proactively.
- Adapt to market changes swiftly with up-to-date data.
Predictive Analytics for Future Planning
Modern BI solutions integrate Artificial Intelligence (AI) and Machine Learning (ML) to deliver predictive insights. Businesses can forecast sales trends, customer behavior, and potential risks, helping them plan ahead and mitigate uncertainties.
Improved Data Accessibility and Collaboration
BI platforms can centralize data from various departments and systems (finance, sales, marketing, operations), breaking down silos and promoting cross-functional collaboration. Employees across teams can access a single source of truth, ensuring data consistency and better coordination.
Smoother Scalability and Operational Expansion
Cloud-based BI solutions allow businesses to scale analytics workloads without additional hardware investments. They optimize performance through deeper analytics and enable faster data processing. Leveraging AI-driven insights within a BI platform further enhances operations for a growing business.
Enhanced Compliance and Risk Management
Compliance with regulatory requirements is a top priority for the banking, insurance, and healthcare industries. BI tools help organizations:
- Monitor regulatory compliance metrics in real-time.
- Generate automated reports for audits and risk assessments.
- Detect fraud and anomalies through AI-driven insights.
What is Power BI?
Microsoft Power BI is a powerful business intelligence and data visualization tool that enables organizations to transform raw data into meaningful insights. As one of the leading BI solutions in the market, Power BI provides businesses with an intuitive platform to collect, analyze, and visualize data from multiple sources, helping them make faster, data-driven decisions.
Designed for users of all technical levels, Power BI eliminates the need for complex coding or advanced data science expertise. It offers a drag-and-drop interface, natural language querying, and AI-driven analytics that empower users to generate interactive reports and dashboards effortlessly.
Microsoft Power BI is widely adopted across industries due to its scalability, real-time analytics, and seamless integration with Microsoft’s ecosystem, including Excel, Azure, Dynamics 365, and Teams, as well as third-party applications like Salesforce, Google Analytics, and SAP.
How Power BI Empowers Organizations with Real-Time Analytics
In today’s dynamic business environment, access to real-time insights is crucial. Power BI enables organizations to:
- Access Up-to-the-Minute Data – Unlike traditional reporting methods that rely on static spreadsheets and delayed updates, Power BI connects to live data sources, ensuring businesses have the most current insights at their fingertips.
- Monitor Key Metrics in Real Time – Businesses can create customized dashboards that track essential KPIs and automatically update as new data flows in, allowing decision-makers to respond quickly to changes.
- Analyze Data from Multiple Sources – Power BI can integrate with hundreds of data sources, from cloud-based platforms (Azure, Google Analytics, Salesforce) to on-premises databases (SQL Server, Oracle). This ensures a holistic view of business performance across all departments.
- Leverage AI-powered Insights – Power BI incorporates AI and machine learning capabilities, allowing organizations to detect trends, predict outcomes, and uncover hidden patterns in their data—helping them stay ahead of the competition.
- Improve Collaboration Across Teams – With Power BI Service, teams can share reports, collaborate on dashboards, and work with real-time data across departments, breaking down silos and ensuring consistency in decision-making.
Why Businesses Choose Power BI Over Other BI Tools
Power BI stands out from other BI solutions due to its:
- User-Friendly Interface – Unlike complex BI platforms, Power BI is designed for both technical and non-technical users, making data analytics more accessible.
- Affordability and Scalability – Power BI offers a cost-effective solution for businesses of all sizes, from startups to large enterprises.
- Advanced AI and Machine Learning – Built-in AI tools enable organizations to conduct deeper data analysis without needing a team of data scientists.
- Cloud and On-Premises Deployment—Businesses can choose between the cloud-based Power BI Service and the desktop version for on-premises use.
- Robust Security Features – Power BI includes role-based access control, encryption, and compliance certifications, ensuring data security and governance.
Power BI as a Foundation for Business Intelligence in Lumify360
While Power BI is a powerful tool, its full potential has been unlocked when integrated with the comprehensive Lumify360 analytics platform. By embedding Power BI as its native data visualization and reporting engine, Lumify360 has enhanced its BI capabilities, offering industry-specific dashboards, risk-adjusted KPIs, and predictive analytics for various sectors.
With Power BI integration in Lumify360, businesses gain a holistic, real-time analytics solution that goes beyond traditional BI—driving smarter decision-making, improving operational efficiency, and unlocking new growth opportunities.
Key Features and Benefits of Power BI
Microsoft Power BI is a powerful and widely used business intelligence (BI) tool offering advanced features that help organizations analyze, visualize, and share data more effectively. Here, we briefly explore the key features and benefits of Power BI to organizations.
Data Visualization and Interactive Dashboards
Power BI provides rich, interactive visualizations that allow users to explore data using charts, graphs, maps, and tables. The platform supports drag-and-drop functionality, allowing custom dashboards and reports without requiring advanced technical knowledge.
- Convert complex datasets into easy-to-understand visuals that enhance decision-making.
- Use dashboards that update automatically with real-time data, ensuring you always have the latest insights.
- You can create personalized dashboards focusing on specific KPIs and metrics relevant to organizational goals.
AI-Driven Analytics and Data Modeling
Power BI integrates AI and ML to help users detect trends, identify anomalies, and forecast future outcomes. With features like Quick Insights and Natural Language Querying, Power BI makes data analysis more accessible.
- AI-driven analytics help businesses anticipate market trends, identify risks, and optimize strategies.
- You can ask questions in plain language (e.g., “Show me last quarter’s revenue growth”), and Power BI provides instant answers with auto-generated visualizations.
- Power BI enables complex data modeling, allowing organizations to connect different datasets and uncover hidden correlations.
Self-Service BI for Non-Technical Users
Power BI is designed for both technical and non-technical users, offering an intuitive self-service BI experience. Users can create reports, explore data, and generate insights without relying on IT teams or data analysts.
- Employees across departments (marketing, finance, sales, operations) can access and analyze data independently.
- With self-service analytics, users can get answers instantly instead of waiting for IT-generated reports.
- Organizations can free up IT resources by allowing end-users to explore data independently.
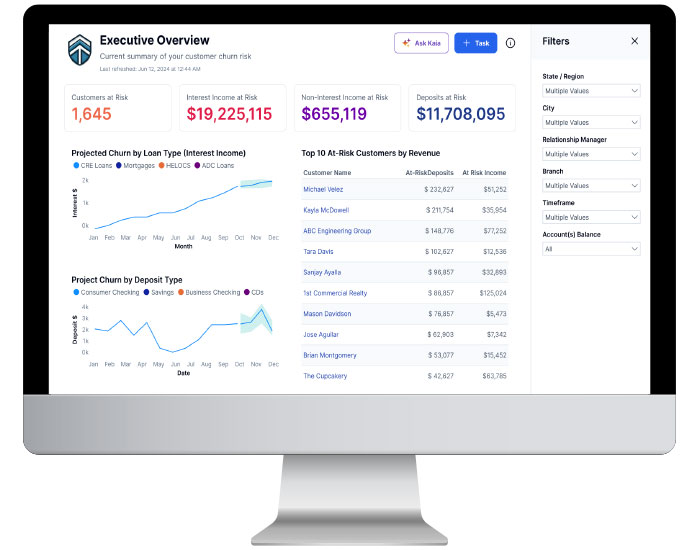
Power BI Dashboards: Transforming Business Insights
Modern organizations rely on real-time data visualization to make informed decisions. Power BI dashboards can serve as the central hub for business intelligence, offering users an intuitive way to analyze and interpret data at a glance. By aggregating data from multiple sources and displaying it in a customizable, interactive format, Power BI dashboards help businesses track performance, identify trends, and respond proactively to challenges.
How Power BI Dashboards Enhance Reporting and Decision-Making
Traditional reporting methods often involve static spreadsheets and periodic reports, which may not provide businesses the agility to respond to dynamic market conditions. Power BI dashboards solve this challenge by offering:
- Real-Time Insights: Power BI dashboards update dynamically, ensuring users can always access the latest business data for timely decision-making.
- Data Centralization: Dashboards consolidate data from disparate sources including CRM systems, financial databases, cloud services, and on-premises servers providing a unified view of business operations.
- Intuitive Visualizations: Instead of sifting through complex datasets, users can view KPI trends and anomalies through interactive charts, graphs, and heat maps.
- Drill-Down Capabilities: Users can explore underlying data with a single click, diving into specifics without needing separate reports or spreadsheets.
- Collaborative Decision-Making: Power BI dashboards can be shared with stakeholders, enabling cross-department collaboration and data-driven discussions.
Customization and Real-Time Data Monitoring
One of Power BI’s greatest strengths is its ability to tailor dashboards to suit specific business needs. Organizations can customize dashboards to display the most relevant metrics and configure them for specific roles and departments.
Key Customization Features:
- Drag-and-Drop Interface: Users can design dashboards using a simple, no-code interface, arranging visual elements to fit their workflow.
- Personalized KPIs: Dashboards can highlight key business metrics, such as revenue growth, customer retention, operational efficiency, or risk exposure.
- Role-Based Views: Different teams—finance, sales, operations, and IT—can customize dashboards to focus on their specific objectives.
- Alert & Notification System: Businesses can set up automated alerts that notify decision-makers when certain thresholds are met, such as a sudden dip in sales or a compliance risk exceeding tolerance levels.
Use Cases: How Businesses Can Leverage Power BI Dashboards
Power BI dashboards cater to a wide range of industries and business functions. Below are a few examples of how businesses use them to drive performance improvements:
- Financial Management: Track revenue, expenses, and profit margins in real-time, ensuring better financial planning and cost control.
- Sales & Marketing Analytics: Monitor lead conversions, customer engagement, and campaign performance to optimize marketing strategies.
- Operational Efficiency: Identify bottlenecks and inefficiencies in supply chain processes, helping companies reduce waste and improve productivity.
- Regulatory Compliance: Financial institutions and healthcare organizations can use dashboards to track compliance metrics, ensuring they meet regulatory requirements.
- Risk Management: Detect potential fraud, cyber threats, or operational risks through AI-driven anomaly detection.
Power BI Dashboards + Lumify360: A Smarter Approach to Business Intelligence
While Power BI provides powerful dashboarding and reporting capabilities, Lumify360 enhances these capabilities by integrating Power BI as its native data visualization and reporting tool. This integration allows businesses to:
- Seamlessly connect their internal and external data sources within Lumify360.
- Leverage Power BI’s advanced analytics features without additional setup.
- Combine business intelligence and predictive analytics for real-time decision-making.
- Access industry-specific dashboards tailored for banking, insurance, healthcare, and manufacturing.
By harnessing Power BI dashboards within Lumify360, businesses can move beyond static reports and embrace a genuinely dynamic, data-driven decision-making process.
Lumify360 Integration of Power BI for Smarter Analytics
While Power BI is a powerful business intelligence tool, it offers much more when integrated into a broader analytics ecosystem. Lumify360 enhances Power BI’s capabilities by providing a unified data intelligence platform that centralizes business metrics, risk factors, and performance insights in real-time. This integration enables organizations to visualize data and drive strategic, risk-aware decision-making with enriched, AI-powered analytics.
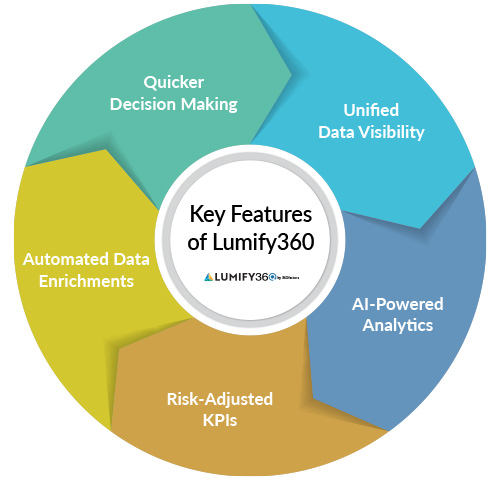
Key advantages of Power BI integration in Lumify360 involve the following:
Unified Data Analytics Across Systems
Organizations often struggle with fragmented data sources, requiring manual efforts to consolidate and interpret insights. Lumify360 solves this challenge by integrating Power BI dashboards with multiple internal and external data streams, ensuring that businesses have a single source of truth for performance monitoring and risk analysis.
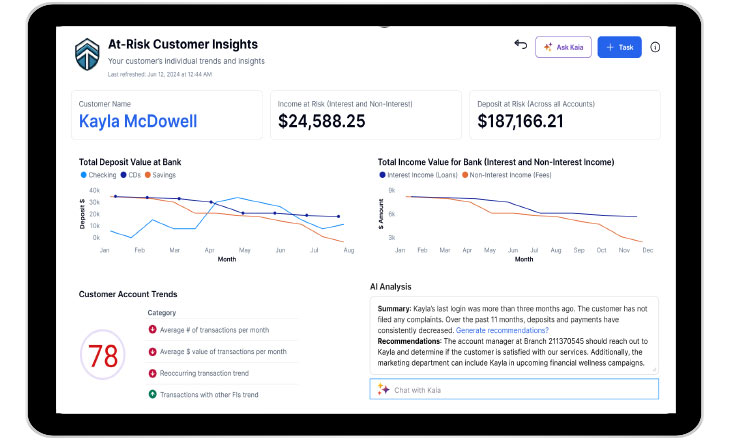
AI-Powered Predictive Analytics
While Power BI enables historical and real-time data visualization, Lumify360 furthers analytics by embedding AI-driven predictive insights into dashboards. With its AI companion, Kaia, users can:
- Ask natural-language questions to uncover trends and risks.
- Generate automated performance forecasts and risk alerts.
- Receive intelligent recommendations for optimizing KPIs and mitigating risks.
Risk-Adjusted Performance Metrics
Lumify360 contextualizes Power BI visualizations with risk-weighted performance indicators (KRIs and KPIs). This allows organizations to:
- Assess how external risk factors impact operational performance.
- Make informed decisions by balancing growth opportunities with compliance and risk considerations.
- Gain deeper insights into financial stability, regulatory exposure, and operational resilience.
Automated Data Enrichment for More Accurate Insights
Traditional BI platforms often require extensive manual data preparation. Lumify360 automates this process by:
- Enriching Power BI dashboards with external market, regulatory, and risk data to provide a more comprehensive view.
- Cleaning, structuring, and categorizing data before it is used within a Power BI dashboard to reduce manual effort and improve accuracy.
- Ensuring governance and security controls are in place to maintain data integrity across analytics workflows.
Faster, More Actionable Decision-Making
By embedding Power BI within Lumify360’s performance management framework, decision-makers gain:
- Customized dashboards tailored to their industry and regulatory needs.
- Automated alerts when performance trends indicate potential risks.
Industry-Specific Applications of Power BI in Lumify360
The integration of Power BI within Lumify360 delivers tailored analytics solutions that cater to the unique needs of different industries. By combining real-time data visualization, predictive insights, and risk-adjusted performance metrics, Lumify360 ensures that businesses across banking, insurance, healthcare, manufacturing, and IT/telecom can unlock strategic intelligence and confidently make data-driven decisions.
Banking & Financial Services
Financial institutions operate in a highly regulated, risk-intensive environment where real-time insights are essential. Lumify360’s integration with Power BI helps banks:
- Monitor credit risk and liquidity by analyzing real-time financial data.
- Assess compliance risks by tracking evolving regulatory changes and their impact.
- Detect fraud and anomalies using AI-powered predictive analytics.
- Enhance profitability insights with real-time loan performance, asset quality, and capital adequacy visualization.
Example: A mid-sized bank can use Lumify360’s Power BI dashboards to correlate customer transaction patterns with risk indicators, enabling early fraud detection and proactive compliance reporting.
Insurance
The insurance industry relies heavily on data-driven risk modeling to optimize underwriting, claims processing, and fraud detection. With Power BI integration, Lumify360 can help insurers by:
- Improving claims management through automated trend analysis and anomaly detection.
- Optimizing underwriting models with AI-driven risk scoring.
- Tracking policyholder behavior to develop personalized insurance products.
- Enhancing regulatory compliance by mapping claims and policy data against evolving regulations.
Example: An insurance company can use Lumify360’s Power BI integration to analyze claims processing efficiency across multiple regions, identifying delays and fraud risks in real-time.
Healthcare
Hospitals and healthcare providers need real-time insights into patient care, financial performance, and compliance. Lumify360 with Power BI can support healthcare organizations:
- Analyze patient treatment effectiveness with AI-driven health metrics.
- Monitor hospital resource utilization to improve operational efficiency.
- Track regulatory compliance with HIPAA and other healthcare data security laws.
- Forecast patient demand and adjust staffing and inventory accordingly.
Example: A hospital network integrating Lumify360’s AI-powered dashboards can track readmission rates, allowing administrators to take preventive actions and improve patient outcomes.
Manufacturing
Manufacturers require real-time visibility into supply chain operations, production efficiency, and cost management. Lumify360 with Power BI integration can be leveraged to:
- Monitor KPIs such as production downtime, output efficiency, and defect rates.
- Analyze supply chain risks by integrating external market data.
- Optimize inventory management with AI-driven demand forecasting.
- Ensure compliance with safety and quality control regulations.
Example: A global manufacturer may integrate Lumify360’s Power BI dashboards to track machine performance data, reducing unplanned downtime and improving maintenance scheduling.
IT & Telecom
IT and telecom companies manage vast amounts of data related to network performance, cybersecurity, and customer experience. Lumify360’s Power BI integration helps by:
- Tracking network uptime and latency to improve service quality.
- Monitoring cybersecurity threats with AI-driven risk detection.
- Analyzing customer churn and satisfaction with real-time engagement metrics.
- Managing IT compliance with industry regulations like GDPR and SOC 2.
Example: A telecom provider can use Lumify360 to analyze real-time network performance data, allowing for proactive issue resolution before service disruptions occur.
Conclusion
Unlock the Full Potential of Business Intelligence with Lumify360
The integration of Power BI within Lumify360 redefines how businesses harness data for strategic decision-making. AI-powered analytics, interactive dashboards, and automated reporting enable organizations to move beyond static reports and embrace real-time, predictive intelligence. With seamless Power BI integration, Lumify360 empowers businesses to unlock deeper insights, enhance risk management, and drive performance with data-driven precision.
By centralizing analytics within a single platform, businesses can eliminate data silos, improve operational efficiency, and proactively address risks and opportunities. Whether it’s financial forecasting, regulatory compliance, or operational optimization, Lumify360 ensures that organizations have the insights they need to stay ahead in a rapidly evolving market.
Take the Next Step
Experience how Lumify360, with native Power BI integration, can transform your approach to business intelligence. Gain access to real-time insights, AI-powered analytics, and intuitive visualizations designed to optimize decision-making at every level.
Take the first step toward a smarter, data-driven strategy:
- Explore Lumify360: Learn how our platform streamlines analytics and enhances business intelligence.
- Request a Demo: See Lumify360 in action and discover its impact on your organization.