Organizations generate massive volumes of data every day. The challenge isn’t collecting this data but turning it into insights that drive smart decisions. Traditional methods—like static spreadsheets or fixed dashboards—no longer meet the speed and depth of today’s business demands. Interactive visualization tools solve this gap. These dynamic platforms help users explore data in real time, uncover trends faster, and make clear, confident decisions.
As companies depend more on data to navigate complex markets, business analytics software must evolve. Static reports aren’t enough. Interactive visualizations transform raw numbers into intuitive, actionable stories that empower users at all levels.
Moving Beyond Static Reports to Interactive Exploration
Data analysis has come a long way. Early tools provided static charts and predefined graphs, offering a limited view of past performance. These methods lacked flexibility and could not respond in real time.
Visualization tools changed the game. Users no longer have to wait for scheduled reports. Instead, they can engage directly with live data, apply filters, and dive into specific details. Dynamic charts, heat maps, and layered views offer a deeper look into trends from multiple perspectives.
A modern data analytics platform supports this level of interaction. It lets teams analyze and respond to data faster, both for routine updates and strategic decisions.
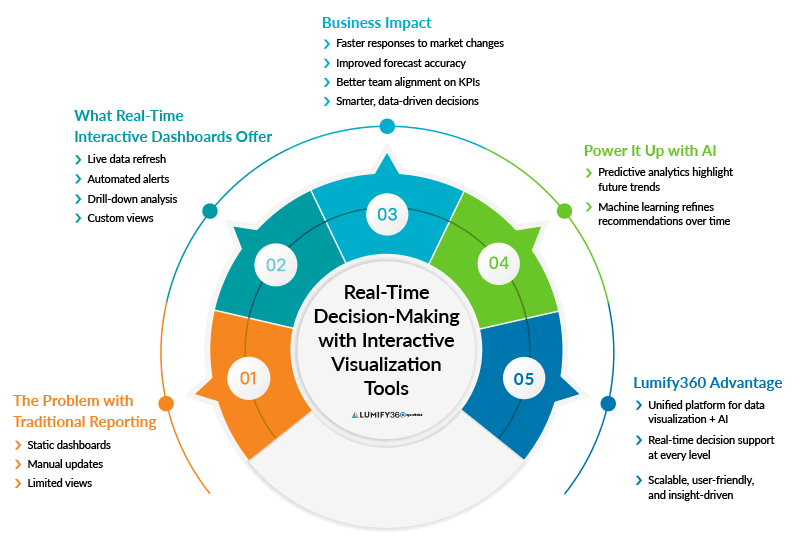
Real-Time Decision-Making for Agile Businesses
One of the biggest benefits of interactive visualization tools is real-time decision-making. In fast-moving markets, static reports fall behind. Interactive dashboards keep decision-makers updated with live information.
Real-time queries, automated alerts, and instant data updates help organizations respond quickly to market changes, supply chain issues, or shifting customer needs. When paired with AI-powered predictive analytics, these tools help businesses anticipate trends and act ahead of time.
By combining forecasts with visual dashboards, companies don’t just look back; they see what is coming next. This forward-looking approach gives them a clear edge.
Enhancing Collaboration Across Teams
Cross-functional collaboration drives modern business success. But siloed data often blocks effective teamwork. Interactive visualization tools solve this by offering shared dashboards and unified views accessible to all departments.
Sales, marketing, operations, and finance teams can each analyze data through their lens while working from a single, consistent source of truth. This shared approach boosts the alignment around business goals.
For organizations using performance management tools, these dashboards support transparency and speed up alignment. Teams become more informed and more agile, adjusting strategies and tracking progress together.
Customizing Data Views for Better Insights
Separate roles need different perspectives. Executives focus on the big picture, while analysts dive into details. Visualization tools make this easy by allowing users to build dashboards tailored to their needs.
Users can filter data, customize layouts, and organize views based on their goals. This flexibility makes data analysis accessible for both technical and non-technical users.
Business analytics reporting software automates updates and delivers reports on schedule. This eliminates manual work and ensures everyone stays informed, improving decision-making.
The Importance of Clean, Reliable Data
No matter how advanced interactive visualization tools are, their value depends on data quality. Inaccurate or inconsistent data leads to flawed insights.
Data cleansing tools ensure information is accurate, consistent, and ready for analysis. These tools remove duplicates, fix errors, and enforce consistency across datasets. Clean data builds trust in visual insights and supports fast, reliable decisions.
When dashboards reflect accurate data, users gain the confidence to act with precision and speed.
Empowering Smarter Decisions with Lumify360 Interactive Visualization Tools
Businesses need more than pretty visuals to unlock the full power of interactive analytics. They need a platform that combines data management and analysis with ease of use. Lumify360 delivers just that.
Lumify360 offers customizable dashboards, real-time data access, and AI-powered predictive analytics in one platform. Users can explore metrics effortlessly, apply filters instantly, and view performance from different angles.
By integrating performance management tools, Lumify360 helps teams align actions with goals. Everyone—from executives to frontline teams—can monitor KPIs and respond with data-backed strategies.
The platform also adapts to growing data needs. With easy data aggregation and automated alerts, organizations can make faster decisions. Role-based access to dashboards ensures that each user sees what matters most while keeping the data secure.
Lumify360 turns complex data into clear insights. It helps businesses move from reaction to action fast.
Conclusion: Visualize Success with Lumify360
In a world full of data, clarity and speed matter more than ever. Interactive visualization tools help businesses explore data in real time, break down silos, and make smarter decisions.
Lumify360 enhances these capabilities with a comprehensive data analytics platform. It combines powerful visualizations, AI-powered predictive analytics, and performance management tools in a single solution. By improving data accuracy and accessibility, Lumify360 enables organizations to act confidently and stay ahead of change.
Explore Lumify360 to unlock deeper performance insights, improve team collaboration, and turn data into a strategic advantage.